Additional Multi-Column Pivot Statistics

Version 3.5.4
Available Date June 2023
Products Ri360, CommBi

Statistics columns can now be added to trended multi-column pivot tables.

New Stats

Previously unavailable, dashboard authors can now add column statistics to the right of trended values in a multi-column pivot table. The supported statistics include Total, Average, Minimum, Maximum, Average, and Count.


Wider Range of Pie Chart Colors

Version 3.5.3
Available Date April 2023
Products Ri360, CommBi

A wider range of colors are now available. Previously, a limited range of colors would lead to repeated pie slice colors.


New Big Number Visualization

Version 3.5.2
Available Date December 2021
Products Ri360, CommBi

There is a new Big Number Visualization that provides detail change details combined with a spark line.

End User Experience

With a quick glance, the dashboard viewer gleans data about a single metric:

  • Two big number values options:

    • Most recent period value (previously this was the only option)

    • Total amount across entire period range

  • Start date and amount

  • End date and amount

  • Change in amount from a previous period

Enhanced spark line and change amounts are displayed.

These two sets of big numbers represent the various display options.

Display change from chart to chart.


Dashboard Author Experience

The dashboard designer uses new configuration options available in the Series Panel configuration. Under Configure Visual, choose the “Individual Line Chart” option.


Under the Change Options menu, each series in the panel has independent configuration options.


Display Change Between Periods

Version 3.5.2
Available Date December 2021
Products Ri360, CommBi

Ri360 can now display change between snapshots. This capability is available in Pivot Panels and Series Panels.

End User Experience

Ri360 already displays trended pivot values - one of our most popular visualizations.

Trended pivot amounts


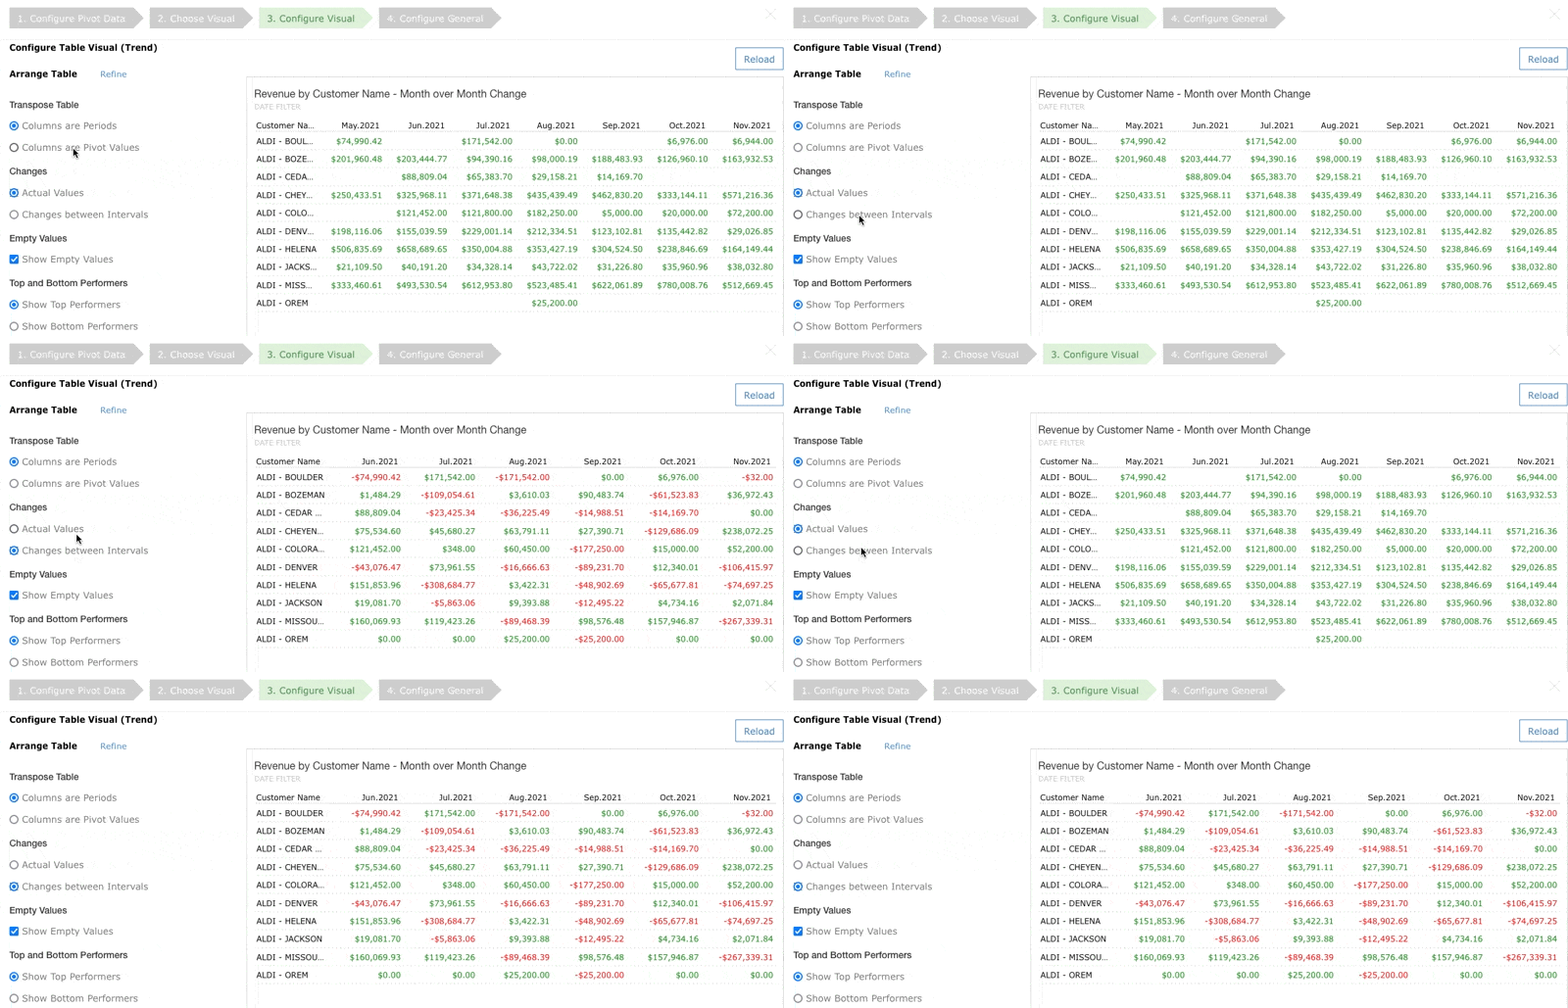
Ri360 can now display the variance for each pivoted value, period by period. The image below shows that ALDI-BOULDER decreased $32.00 from October 2021 to November 2021.

Trend pivots displaying change between periods


Dashboard Author Experience

The Configure Visual section contains an option to change between Actual Values and Changes between Intervals.

Toggle between actual and changes


JWT Single Sign On

Version 3.5.1
Available Date October 2021
Products Ri360 SaaS

The Ri360 SaaS product line can be configured to use a JSON Web Token (JWT) as a form of Single Sign On (SSO).

Enterprise on-premise clients can currently use a Microsoft Active Directory integration to provide SSO capability.

The JWT SSO approach allows a web-based application to pass a JWT object to Ri360 as URL parameter. Ri360 validates the JWT object and allows an immediately log into the Ri360 application without entering a username or password.


Dashboard Filters

Version 3.5.0
Available Date April 2021
Products Ri360, CommBi

Information dashboards can now be filtered across several panels at once. Panels could already be individually filtered using existing functionality. This new feature allows multiple filters to be applied to a dashboard.

End User Experience

The end user can select from a list of filters in order to apply a filter to the dashboard.

When configured, a dashboard filter drop down box appears in the top center of a dashboard.


The user selects from a filter list.


Dashboard Author Experience

Dashboard authors have the option to edit the filter drop down list in dashboard edit mode.

Edit an existing filter list by clicking the pencil icon.


Step 1 - select your anchor filter. This is a filter that is currently defined on the panels. All occurrences of this filter will be replaced with a filter the user selects from the drop down list.

Select the anchor filter.


Step 2 - select the filters that will be listed in the drop down list. All filters that exist across the dashboard’s datasheets are listed.

Add and remove filters from the drop down list.

Guides

Version 3.5.0
Available Date April 2021
Products Ri360, CommBi

A data analytics best practice is documenting dashboards, reports, and lists. Guide documentation can now be added to dashboards and datasheets. Guides enhance usability and provide an integrated approach to business documentation for your data analytics.

End User Experience

The end user can click on the Guide button in both dashboards and datasheets.

The Guide button is located in the dashboard toolbar.


The Guide button is located in the datasheet toolbar.


Click on the guide button in the toolbar to view the guide documentation.

The user is shown a fully formatted document.


Guide Author Experience

Any users that has the Author Guide ability assigned to their user account is able to modify guide documents.

Click on the Edit Guide button.

Click on the Edit Guide button to modify the document.


A full rich text editor is provided. You can apply coloring, change text size, insert lists, insert hyperlinks, display images, and more.

Apply the changes once you are finished.

Use the rich text editor to modify the document.